Control your Data
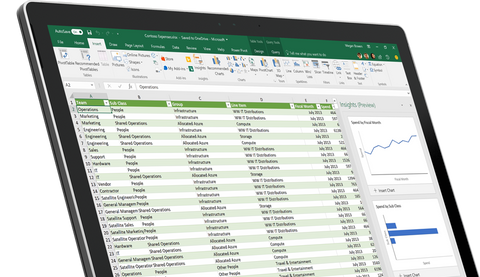
Analyze and visualize your data in new and intuitive ways with a fresh user interface plus your favorite keyboard shortcuts. Leverage features like Analysis Toolpak, Slicers, and Formula Builder to save time, so you can focus on insights.
Visualize Output
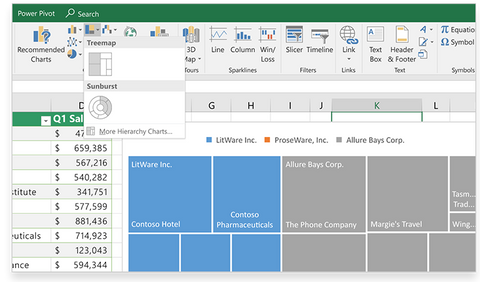
New charts and graphs are included with Excel 2016 to present your data in an exciting and compelling way. Utilize sparklines, tables and graphs to help your work tell a story.
New Tools
Excels new tools work with you to suggest applicable charts or predict repetitive cell populating with duplicate data. Flash Fill is arguably the easiest way to reformat and rearrange your data. Excel learns and recognizes your pattern to auto-complete the remaining data, and requires no additional formulas or macros.
Simplified Sharing
Easily share your work with others to make collaboration even easier than before. When you save your workbooks, they are saved to SkyDrive or SharePoint by default. You are able to send links to the same file to as many people as you like, which includes their viewing and editing permissions; this way, you can be assured that everyone sees the latest version.
Microsoft Excel 2016 provides you with an intuitive and dynamic system that helps you to visualize and analyze your data. You are able to bring new insights to light and make the most of your important information, whether you are tallying your expenses in a spreadsheet or tracking gains in revenue. Workbooks are now easier to share than ever, giving you the flexibility to cooperate with others on projects and access your workbooks from anywhere.
What's new in Microsoft Excel 2016
Excel is the world's most widely used and familiar data analysis tool, especially now with the new Power BI and Power BI Desktop to provide business analysts with a powerful portfolio of analytic tools unique in the industry. The software has new and improved business analytics features and makes improvements to the design with analysts in mind.
Microsoft Excel 2016 now comes with built-in functionality that brings ease and speed to getting and transforming your data, allowing you to find and access all the data you need into one place. These new capabilities, previously only available as a separate add-in called Power Query, can be found within Microsoft Excel 2016. Access them from the Get & Transform section on the Data tab.
The Query Editor, which opens when creating a new query or opening an existing one under Get & Transform, provides intuitive data shaping and transformation options, enabling you to prepare a data set with only the information you want to see and in the way you want to see it. Each step you take to transform the data can be repeated and rearranged to help you work faster and more efficiently. When you refresh the data connections, every step you took to transform the data is preserved. And once you have the information prepared, you can share your queries easily with others.
Additional features available under the Get & Transform section include accessing recent sources you've used in previous queries and options to combine queries together. With a premium version* of Excel 2016 and a Power BI license, you can also use search to discover corporate data available to you across your company that is shared in a corporate catalog or even share your own queries with others.


